Archive for 2016

  • Tenkan-sen (Conversion Line):(9-period high + 9-period low)/2)) On a daily chart, this line is the mid point of the 9-day high-low range, which is almost two weeks. Kijun-sen (Base Line):(26-period high + 26-period low)/2)) On a daily chart, this line is the mid point of the 26-day high-low range, which is almost one month. Senkou Span A (Leading Span A): (Conversion Line + Base Line)/2)) This is the midpoint between the Conversion Line and the Base Line. The Leading Span A forms one of the two Cloud boundaries. It is referred to as “Leading” because it is plotted 26 periods in the future and forms the faster Cloud boundary. Senkou Span B (Leading Span B): (52-period high + 52-period low)/2)) On the daily chart, this line is the mid point of the 52-day high-low range, which is a little less than 3 months. The default calculation setting is 52 periods, but can be adjusted. This value is plotted 26 periods in the future and forms the slower Cloud boundary.

    USDCAD PROFIT

    I saw the patern setup cooking up nicely for about half an hour. It took quite a while for it…

    by
  • Day trading is the act of buying and selling a stock within the same day. Day traders seek to make profits by leveraging large amounts of capital to take advantage of small price movements in highly liquid stocks or indexes.

    GBPUSD BREAKEVEN

    GBPUSD was a very odd, to trade today. We had many support retests, that, later collapsed to give us buy…

    by
  • The US Dollar v/s the Canadian Dollar is a popular currency pair due to the large amount of cross-border trading activity that takes place between The United States and Canada. The Canadian Dollar is often called 'The Loonie'.

    USDCAD 19.07.2016

    I missed the first entry at 9.10am due to a late start. The price rebounded nicely and I got back…

    by
  • The Ichimoku Cloud, also known as Ichimoku Kinko Hyo, is a versatile indicator that defines support and resistance, identifies trend direction, gauges momentum and provides trading signals. Ichimoku Kinko Hyo translates into “one look equilibrium chart”. With one look, chartists can identify the trend and look for potential signals within that trend.

    Epic loss 14.07.2016 [Stopped Out]

    I trade did not work for me today. My entry looked suspect. The Sen turn was not quite perfect. Biggest…

    by
  • EURUSD 13.07.2016

    I am not to keen on trading EURUSD. The pair is too, fiery for my liking. I saw all the…

    by
  • Forex (or sometimes just FX) is short for foreign exchange, and is the largest financial market in the world. Simply put, it's how individuals and businesses convert one currency to another. FX transactions worth trillions of dollars take place every day, and unlike stocks or commodities there's no central exchange.

    USDJPY LOSS

    I overtraded this but, I do remember that 1 hr was not in my direction. I will learn from this,…

    by
  • Market equilibrium is a market state where the supply in the market is equal to the demand in the market. The equilibrium price is the price of a good or service when the supply of it is equal to the demand for it in the market.

    GBPUSD SHORT TARDE 12.07.2016

    I felt the momentum was right, and the triple top was an indicator to set in. The 1…

    by
  • Developed J. Welles Wilder, the Relative Strength Index (RSI) is a momentum oscillator that measures the speed and change of price movements. RSI oscillates between zero and 100. Traditionally, and according to Wilder, RSI is considered overbought when above 70 and oversold when below 30.

    USDCAD PROFIT 11.07.2016

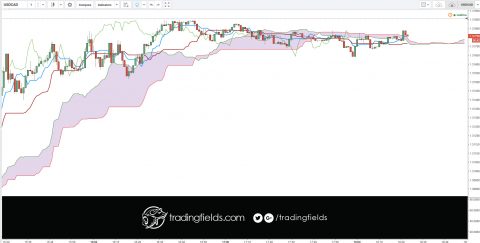
    All currencies on my watchlist were setting up. I took the USDCAD based on the judgment I made looking at…

    by
  • The Ichimoku Cloud, also known as Ichimoku Kinko Hyo, is a versatile indicator that defines support and resistance, identifies trend direction, gauges momentum and provides trading signals.

    USDCHF Close another breakeven

    Another new pair traded today. I was hoping for a quick downward slide. The move bounced at 0.9760. Looking at…

    by
  • Day Trading, as the name implies, is generally limited to trading activity during most of the day trading. It includes the purchase and sale of shares in a short period of time. Day traders buy and sell stocks since the market opened in the morning and sell them off, before it closes.

    Trading a new pair USDCAD

    I am trying to stay clear of GBP, and there were no signals for USDJPY so I took the opportunity…

    by