USDCAD LOSS

USDCAD LOSS
9th May 2018 contacttf
The Ichimoku Cloud, also known as Ichimoku Kinko Hyo, is a versatile indicator that defines support and resistance, identifies trend direction, gauges momentum and provides trading signals. Ichimoku Kinko Hyo translates into “one look equilibrium chart”.

I looked through all my pairs, but there is not much in the way of trade opportunities.

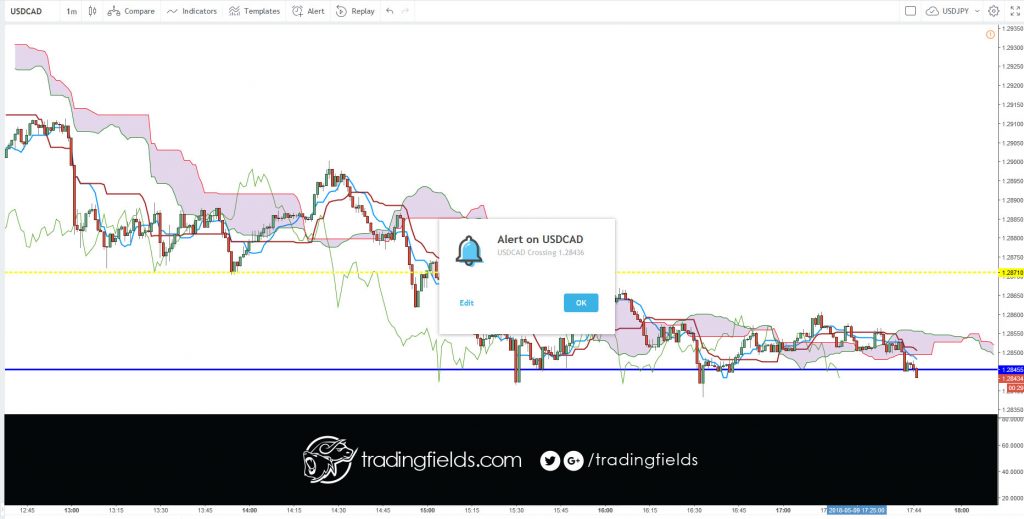
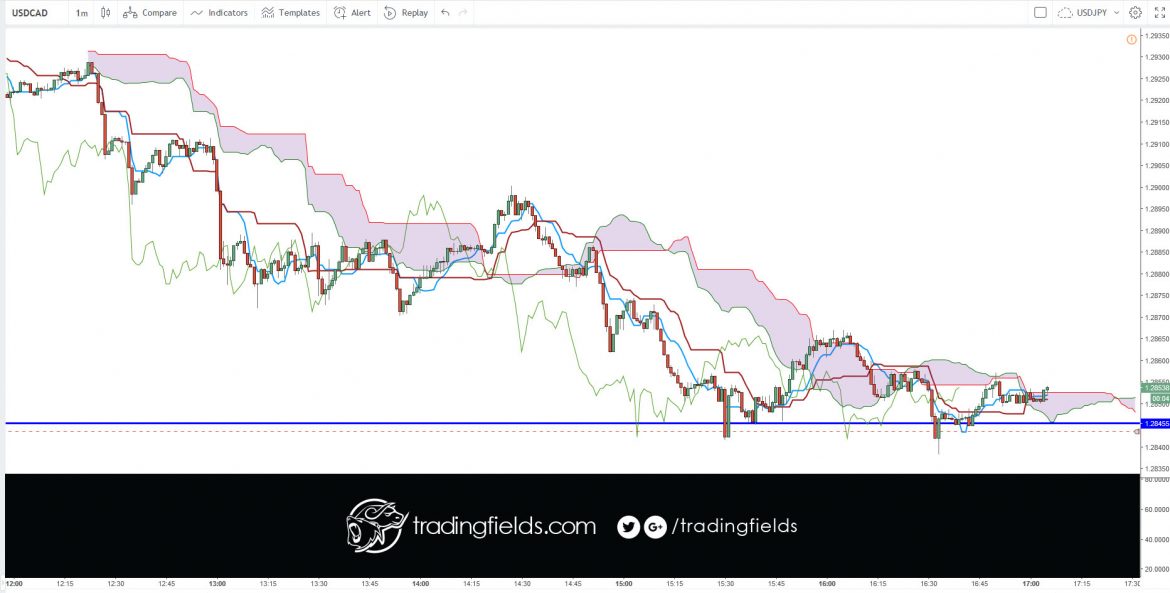
I took the USDCAD trade, because the 15min chart on RSI was showing a pullback. This information gave me the indication for a quick scalp.

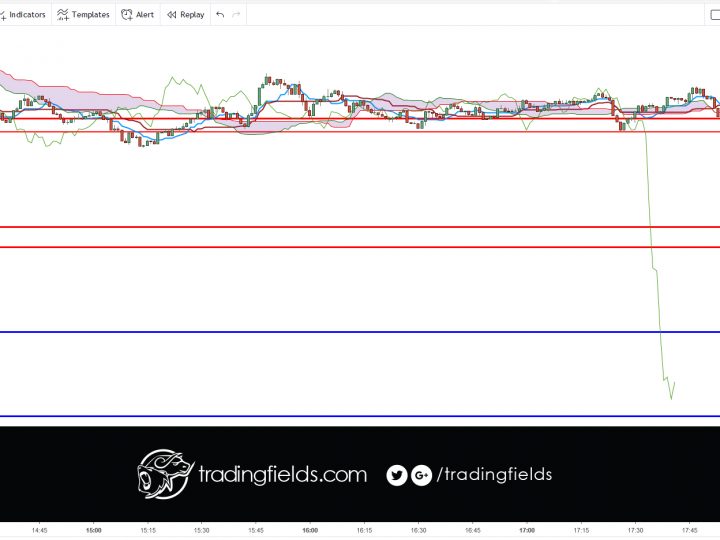
Trade did not work, and in hindsight, I should not have taken the trade.

The relative strength index (RSI) is most commonly used to indicate temporary overbought or oversold conditions in a market. An intraday forex trading strategy can be devised to take advantage of indications from the RSI that a market is overextended and therefore likely to retrace.

0 Comments

Leave a reply

Your email address will not be published. Required fields are marked *

*