USDCHF PROFIT

USDCHF PROFIT
10th January 2019 contacttf
The Relative Strength Index (RSI), developed by J. Welles Wilder, is a momentum oscillator that measures the speed and change of price movements. The RSI oscillates between zero and 100. Traditionally the RSI is considered overbought when above 70 and oversold when below 30.

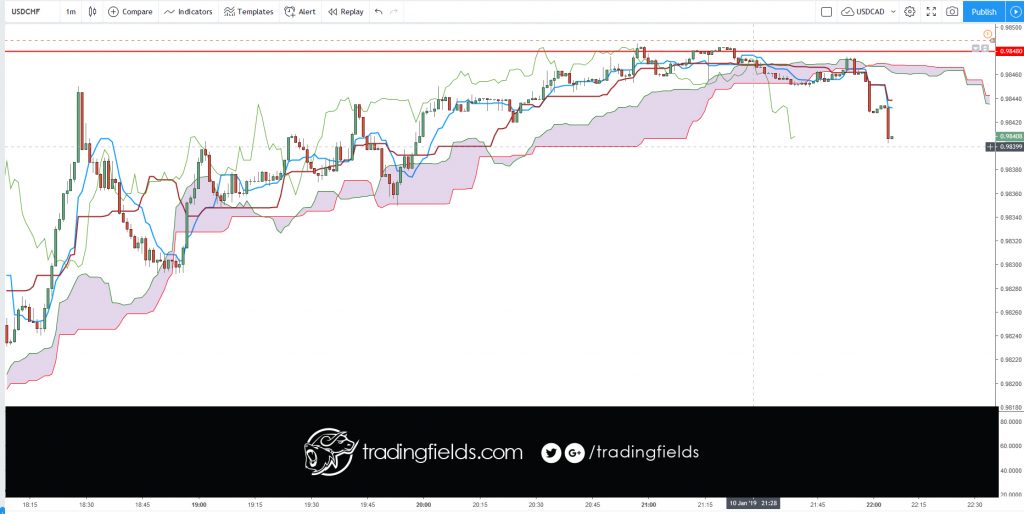
The Swissy was on my Watchlist for some time. USDCHF showed its colours before EURCHF. What I found was that the price was in a tight range, including Divergence on the RSI chart.

Trade taken after seeing the price drift out of the flat Ichimoku cloud.

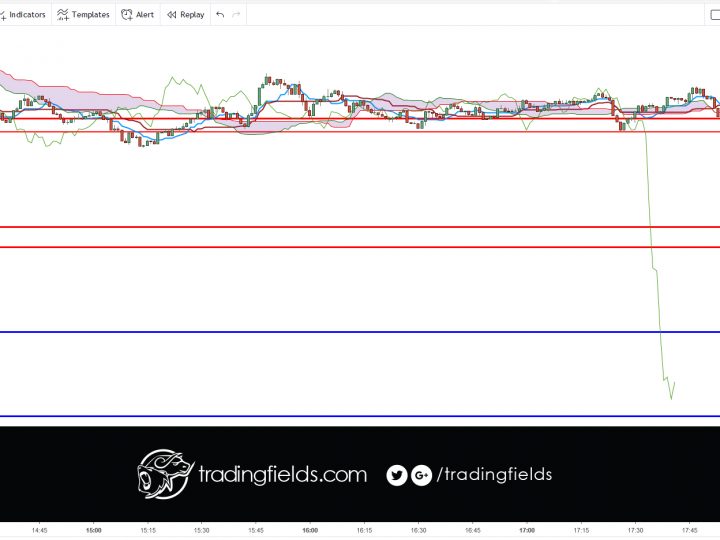
Trade successfully closed because I got a quick return on a late trade.

After trade analysis
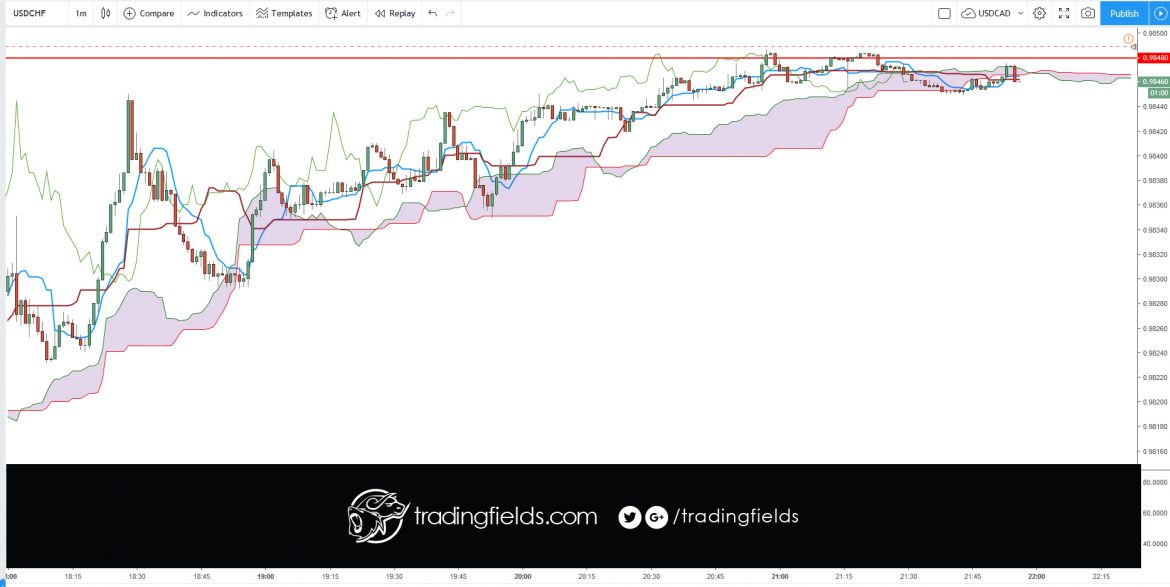
Price is still floating in the same area.

All currency trading is done in pairs. Unlike the stock market, where you can buy or sell a single stock, you have to buy one currency and sell another currency in the forex market. Next, nearly all currencies are priced out to the fourth decimal point. A pip or percentage in point, is the smallest increment of trade.


0 Comments

Leave a reply

Your email address will not be published. Required fields are marked *

*